
Introduction
There are two main parts to a site survey. Firstly, a check of local conditions, secondly, a check of performance of the T24 equipment in the local conditions. This technical document is designed to guide you through the process to achieve optimal conditions.
Local Conditions
The first thing to do is to look around. Problems that you are looking for are physical obstructions and local 2.4 GHz radio use.
Obstructions
This could be anything either in between or near to the transmitter(s) and the receiver. Materials such as concrete and steel absorb and reflect radio signals. Also remember that water is a very good absorber of radio which means that trees in leaf can be very good at blocking the signal. Also, find out what may change when the transmitters are actually going to be used. Is there going to be a lot of vehicle traffic and will that create a moving obstruction leading to data loss?
Local 2.4 GHz radio use
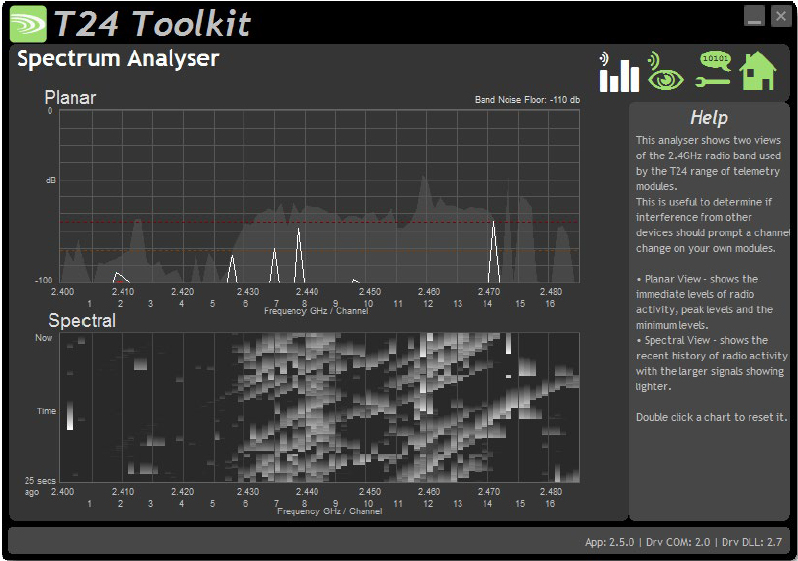
To do this use the Spectrum Analyser part of the T24 Toolkit (ver 2.5.0 and up). You should monitor the local radio conditions both where the receiver is going to be positioned and where the transmitters are going to be positioned. The Toolkit uses the radio signal received by the base station so you can change the orientation to see if that has any effect.
 Planar View Parts
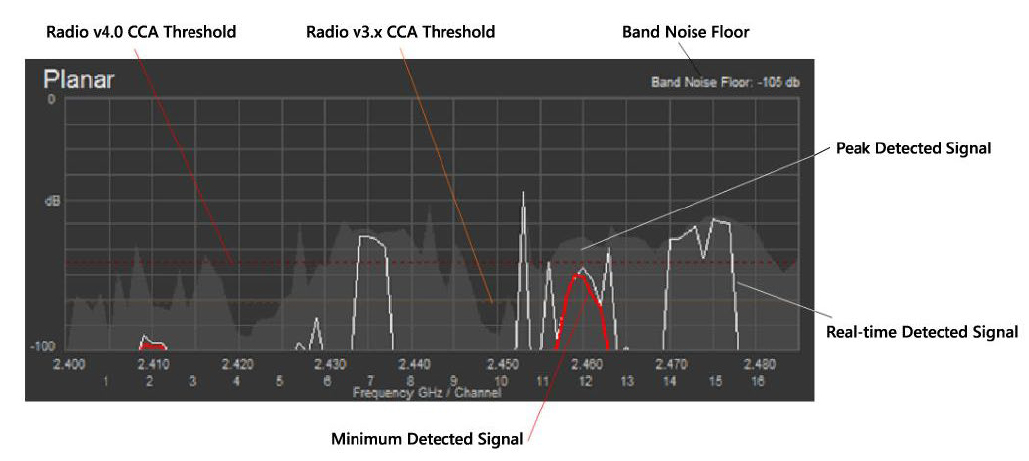
| Real-time Detected Signal | The white trace shows the real-time level of detected signal. On its own this information only really indicates where other radios are operating. T24 works fine with other transmissions but you may want to stay away from channels that have a lot of activity when there are other quiet channels available. |
| Peak Detected Signal | The shaded background shows the peak signal detected across the band. This is more useful than the real-time trace because, over time, this build a picture of where the traffic has the highest power. |
| Minimum Detected Signal | The red trace is very important and shows the minimum signal level detected across the band. In a good, quiet RF environment these red traces will not be visible but where there is a high level of broadband noise or very high amounts of radio traffic you may see channels that show red areas. As long as these remain below the CCA (Clear Channel Assessment) thresholds for the T24 radio modules deployed (<=v3.x or >=v4.0) the T24 radios will still operate but given the choice select a channel that does not show a high minimum signal level. As levels start to increase above -95 db this will reduce maximum achievable radio range. |
| Band Noise Floor | This indicates the lowest signal level across the entire band. Usually this will be off the bottom of the chart but when this is visible it can indicate underlying issues with the environment that could affect the T24 radio operation. As levels start to increase above -95db this will start to reduce maximum achievable radio range. |
| Radio v3.x CCA Threshold | This orange dotted line indicates the signal level at which the version 3.x (and below) radio firmware will not transmit. Any signals detected larger than this level will stop the module from transmitting. Usually this is not a problem as T24 radio works in harmony with other radio systems and will transmit in the gaps between other radio transmissions. However, if the Minimum Detected Signal is close to, or above, this level then the T24 radio system will cease to function. |
| Radio v4.0 CCA Threshold | Version 4.0 radio modules have a revised CCA threshold to allow them to work better in high noise RF environments. |
Examples of RF Environments
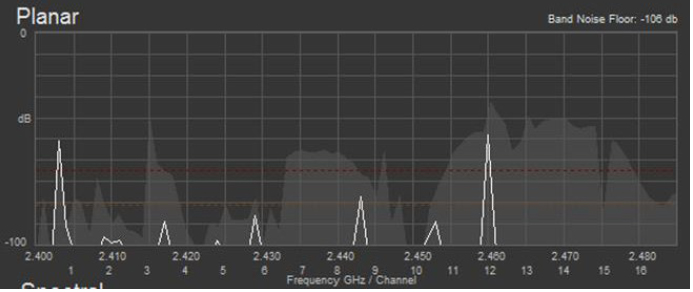
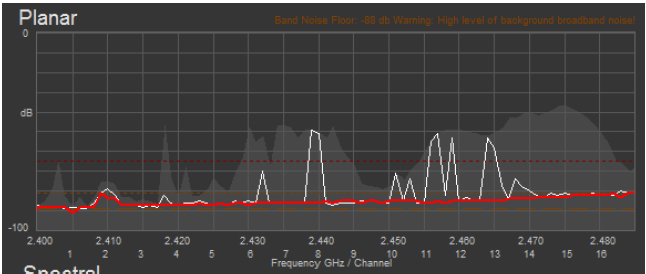
This shows a good RF environment. The Band Noise Floor is low and there are no red traces indicating that there are plenty of signal free gaps to enable T24 to transmit. There is traffic across the whole band with higher signal traffic between channels 11 to 15, but there is nothing that would affect T24 operation.
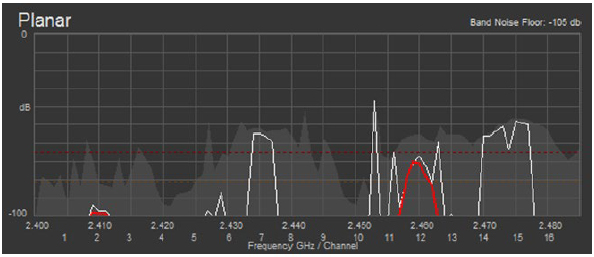
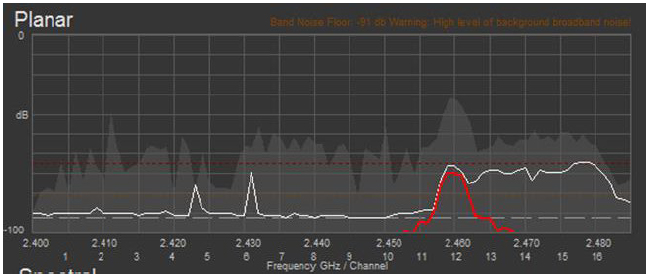
Here we can see some visible red traces indicating the minimum signal levels. Around channel 2 there is something transmitting constantly but the signal is so low that T24 would operate fine anyway. However, channel 12 shows that there is a constant transmission that is above the v3.x radio CCA threshold so those T24 radios would not function on channel 12. Version 4.0 and above T24 radios would function but communications may be erratic and certainly the range and coverage would be reduced. It would not be a good idea to use channel 12.
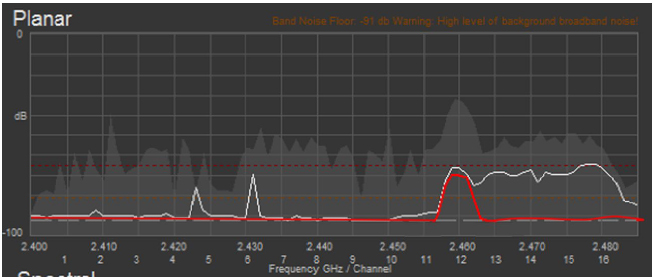
Here we can see a scenario where the entire band noise floor is high. This means that across all channels the range achievable will be reduced because T24 transmissions from distant modules will be swamped by the constant signal from the noise floor. For most channels the minimum signal level is below the CCA threshold, so as long as the T24 signal is strong enough the system will still work. However, note the sloping nature of the red trace. At around channel 16 the minimum signal level is at the level of the v3.x radio CCA threshold so version 3.x radios would not be able to pair because channel 16 is used in the pairing negotiation. V4.0 radios would still operate successfully.
This shows how the display would look if the band noise floor slowly crept up. The red trace is only visible on channel 12 but other channels that were once OK (Having a very low minimum signal level) now have a viewable level of minimum signal noise. A double-click on the planar chart would reset the peak and minimum calculations so the minimum red trace would then follow the more recent higher noise floor – see image below.
Whilst you are doing this, it is a very good idea to take screen shots of the whole window (the spectral view can give a useful history as well). This will be a useful record and could help Mantracourt with fault finding. It will also be useful to note down what the noise floor was as this could limit the possible range.
Now it is a good idea to check how good the link is between the transmitter and receiver. There are two ways to do this. If you want to monitor multiple transmitters, go to the monitor page of the toolkit.
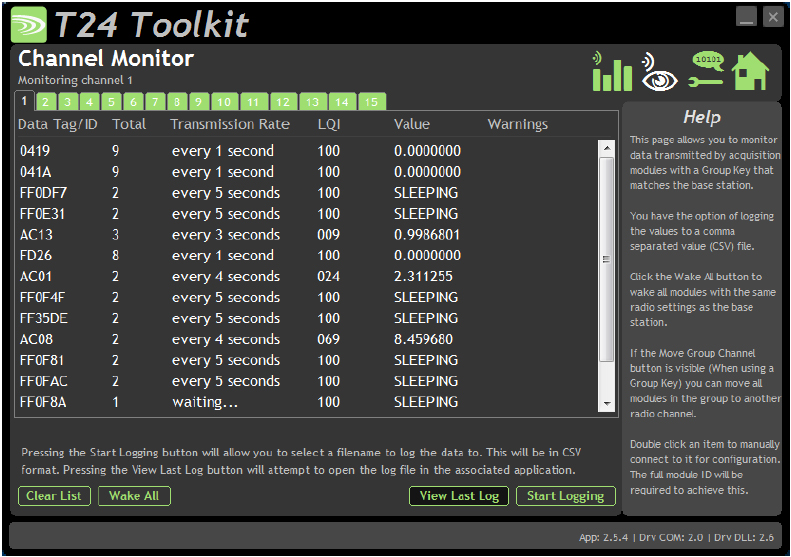 This allows you to monitor all transmitters on the selected channel. It is useful to check how many transmissions are getting through (with the Total column); you can compare the detected transmission rate with what you are expecting (big differences would suggest high radio traffic blocking sending the signal) The LQI column shows the link quality index which is essentially how good the radio signal is. This is in the range 0-100 where 100 is the best. Getting a reading of 80 will still give some headroom.
Double click the LQI heading to see RSSI/CV which gives some more detailed info.
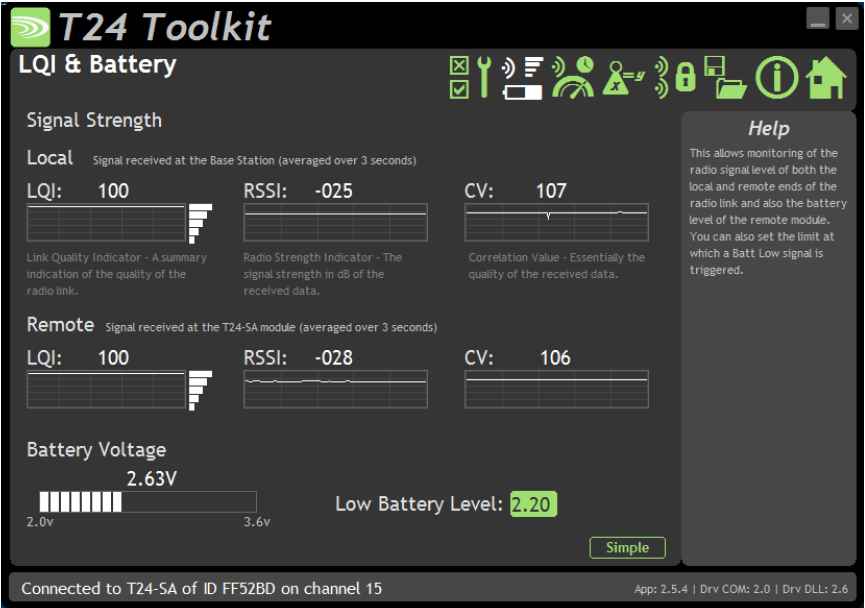
Alternately you can pair to the module and look at the LQI and battery page. This will give you a historic graph of the LQI. Clicking the Advanced button also shows the RSSI and CV.
 For more information contact us
Download PDF